Contents
R language is widely used by all data analysts and researchers around the globe to solve complex problems related to different computer fields. R has a direct relation with statistical data and its representation, and many big companies such as Google, Facebook, Uber, and Airbnb use it for analytics.
The language has brought a major revolution in different rising industries such as Big Data and Data Science analytics. It also facilitates some of our major sectors like Health, Energy, Finance, Insurance, and Retail, etc. to help with all analytics.

R is widely used to solve complex issues and extract data in Academics, where analytics and research is performed on a higher scale. The applications of R are also widespread within analytics and statistics related fields.
What Is R Programming Used for?
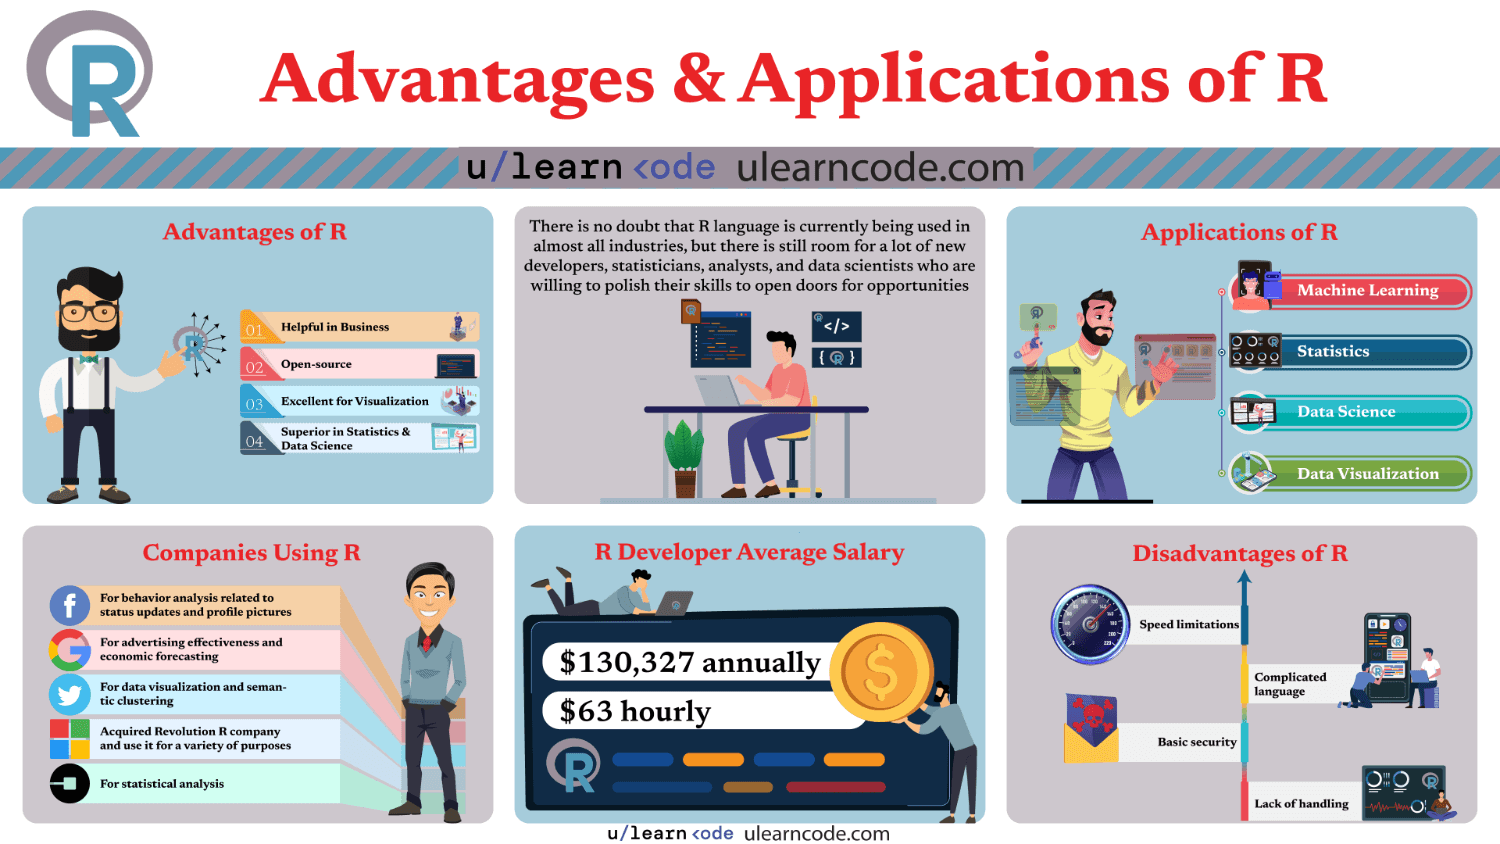
R has a number of applications. Considering its high usage in analytics and statistics related fields, here are four of the major uses of R:
1. Machine Learning
The R language allows you to apply some of the best algorithms for machine learning. R works with a number of packages from TensorFlow and Keras, which facilitate creating powerful algorithms through support of R language.
R is also optimal for machine learning because it supports a number of key components such as:
- decision trees
- predictive analytics
- non-linear regression
All these algorithms can be created and used in different fields such as:
- retail
- health
- marketing
The language is extremely proficient in machine learning and if anyone wants to gain expertise in this specific area, they can join any of the best machine learning courses to learn from the basics.
R has over 12 thousand packages and libraries available, the most popular of which are machine learning libraries. The language itself is excellent, but there are some other languages for machine learning such as Python and Java, which surpass R in some areas.
2. Statistics
Statistics can be complex, but R language makes it easy with over 9,000 libraries specifically dedicated to statistical algorithms. Many statisticians use R language as a tool to solve all their statistics problems.
The large number of libraries has the potential to solve almost all statistics problems. R has a strong core when it comes to statistics and algorithms. There are thousands of techniques that can be used to work on a variety of issues.
If you want to become a statistician, then there are numerous courses available that teach you about statistical algorithms using R libraries. The researchers perform an in-depth analysis using these packages to work on complex statistics.
R is dominant when it comes to the statistics field, but many other languages for Statistical Analytics such as Python are preferred for complex problems.
3. Data Science
Data Science is a huge domain and almost all big organizations tend to analyze their structured or unstructured data with the help of data science techniques. Companies like Facebook, Google, and Uber use the R language for this purpose.
R is one of the most preferred languages for Data Scientists who work in different organizations to use for real-time data. They use R language with its range of libraries to perform in-depth predictive analysis and graphical analytics.
There are numerous languages used for data science purposes, but Python and R are the two major languages in this specific area. Python also has some of the great libraries and frameworks to work on problems with ease.
Data Scientists are in great demand and anyone can step into this field by choosing one of appropriate courses for data science to kick start their career.
4. Data Visualization
The R language is also pretty helpful when it comes to decision-making in business. The data visualization in R is extremely good, and supports a variety of graphical formats such as high-quality drawdown plots and candlestick charts.
R helps data analysts to turn confusing and complex numbers into graphics form, which makes it easy to read and understand. There are separate R libraries available for the visualization of data.
There are many other languages used for data visualization such as Python, Java, and C#, but R and Python are the most dominant in this area.
Why Do We Use R Programming?

So why should one learn the R language, and is it really that easy to learn? R was once considered a very difficult language until tidyverse packages were developed by Hadley Wickham to facilitate the programmers.
The structure of this language is still a little confusing, but data scientists, analysts, and statisticians prefer R for a variety of reasons:
1. It Is Helpful in Business
The R language facilitates almost all major domains and industries including health, insurance, and retail, etc. to extract data and create visualizations. R is extremely good for technical fields and equally helpful with any analytics or statistics related tasks in business.
2. It Is Open-source
R is an open-source language with a strong community that always contributes to making it even better. The language also has a wide range of applications that make it a worthy option to learn for beginners who can enroll in any of the best R courses to open new opportunities with a whopping 12,000 libraries.
3. Excellent for Visualization
R is dominant due to its range of libraries. Two of its popular libraries include ggplot2 and plotly, which allow programmers to create excellent graphical presentations.
4. Superior in Statistics & Data Science
The original purpose of R was to work with different Statistics and their issues, but slowly it moved towards data science fields with its new libraries that made it a competitive choice .
Conclusion
There is no doubt that R language is currently being used in almost all industries, but there is still room for a lot of new developers, statisticians, analysts, and data scientists who are willing to polish their skills to open doors for opportunities.